

Strategies for High-Energy Buildings
Part 1: Defining and Identifying High Energy Buildings in the US
The architectural and engineering community in the U.S. has engaged in designing energy-efficient buildings and helping building owners optimize energy performance in existing buildings since the American Society for Heating, Refrigerating, and Air-Conditioning Engineers (ASHRAE) introduced Standard 90.1 – Energy Efficient Design of New Buildings Except Low-Rise Residential Buildings in 1975. Although progress has been made over the past 44 years, there is still plenty of room for improvement — and that improvement is becoming more critical to the sustainability of society. We will identify and examine high energy buildings and strategies to reduce their energy impact. In Part I of this blog series, we will start by understanding the current state of the U.S. energy use and environmental impact on a global scale, and then define and identify high energy building categories.
GLOBAL CLIMATE CHANGE & U.S. ENERGY USE
The scientific community understands and accepts that global climate change is happening, the U.S. is the second largest global consumer of energy behind China, and there is a positive correlation between energy use and global warming. All this evidence suggests that continued resolve and increased fervor to make buildings use as little energy as possible is required to help avert irreversible, negative impacts to our society. So, where do we go from here?
Global Climate Change: In 2013 the Intergovernmental Panel on Climate Change (IPCC) issued their Fifth Assessment Report (AR5), which details that the average global temperature has increased by 0.85°C (1.53°F) from pre-industrial levels (1880 to 2012). The AR5 also asserts that limiting the average global temperature increase to 1.5°C (2.7°F) from pre-industrial levels has a high likelihood of ensuring a more sustainable and equitable society than allowing that temperature to increase beyond 1.5°C (2.7°F) [1].
U.S. Energy Consumption: According to data collected and analyzed by Enerdata, the U.S. consumed 2,258 million tons of oil equivalent (“Mtoe”) or 89,597 billion thousand British thermal units (“kBtu”) of energy in 2018[2]. This was 71% of the energy consumed by China and 243% more than the third largest global energy consumer: India.
Global Climate Change and Energy Use Relationship: It is widely understood that increased concentration of carbon dioxide (CO2) in our atmosphere has led to the 1.5°C (2.7°F) increase in average global temperatures from 1880 to 2012. There is also a relationship between energy use and greenhouse gas (GHG) emissions. According to the US Energy Information Administration (EIA), most of the emissions of human-caused GHG come from burning fossil fuels for energy use, and, as of 2017, about 80% of all energy consumed in the U.S. is fossil fuel-produced[3]. This means that increasing energy use leads to more fossil fuels being burned, which releases more CO2 into our atmosphere, which leads to increasing the average global temperature.
DEFINE & IDENTIFY HIGH ENERGY BUILDINGS
In general, high-energy buildings tend to have more cost-effective energy savings opportunities, where the cost to deploy energy-saving strategies payback in five years or less. But what is a high-energy building? There are a couple of ways to define high-energy because the term is inherently relative: National/Portfolio method and Building type method. Each method is summarized below. For the purposes of this discussion, we will use a combination of both methods for defining high-energy buildings. For both methods the word “site” is used to define the boundary of energy consumption as measured at the building level by utility meters.
National/Portfolio Method: High-energy building categories have total energy use values at or above the national or portfolio upper quartile (75th percentile). This method is generally used by government agencies and corporations to understand relative energy intensities of building types or categories at a high level (e.g., Industrial, Healthcare, Retail, etc.);
Building Type Method: The building site energy use intensity (EUI, in kBtu/SF) for a building is at or above the national or portfolio upper quartile (75th percentile) site EUI for other, similar buildings. This method is more widely used by the A/E community for both new construction and existing building projects to compare the project building against other similar buildings nationwide.
An analysis was performed using a combination of Energy Star Portfolio Manager[4], 2012 Commercial Buildings Energy Consumption Survey (“CBECS”)[5], and 2014 Manufacturing Energy Consumption Survey (“MECS”)[6] data to identify high-energy building categories in the U.S. The results of this analysis are shown in Figure 1, with the high-energy buildings highlighted in Table 1. The horizontal axis is the total energy used in kBtu and the vertical axis is the average size of the building category in square feet (SF). The size of the circle for each building category represents the average site EUI, where a large circle indicates a large average site EUI and vice versa. Logarithmic scales were used on the horizontal and vertical axes to better illustrate the data. Key results from the analysis are summarized below.
Commercial & Industrial Energy Use in the U.S.: 34,880 billon kBtu (39%) of the 89,597 billion kBtu of energy consumed in the U.S. each year is consumed by commercial and industrial buildings;
Metrics for Identifying Energy Intensive Buildings: The following metrics were used as a basis to identify the high-energy building categories in the U.S.:
The upper quartile (75th percentile) total energy use was 1.95 billon kBtu;
The upper quartile (75th percentile) average site EUI was 85.1 kBtu/SF.
Energy Intensive Buildings: The high-energy building categories in the U.S. are: Manufacturing, Sports & Entertainment, Retail, Food Sales & Service, Education, and Healthcare are the high energy building categories in the U.S. These categories account for 90% of the total energy use in the U.S. from commercial and industrial buildings.
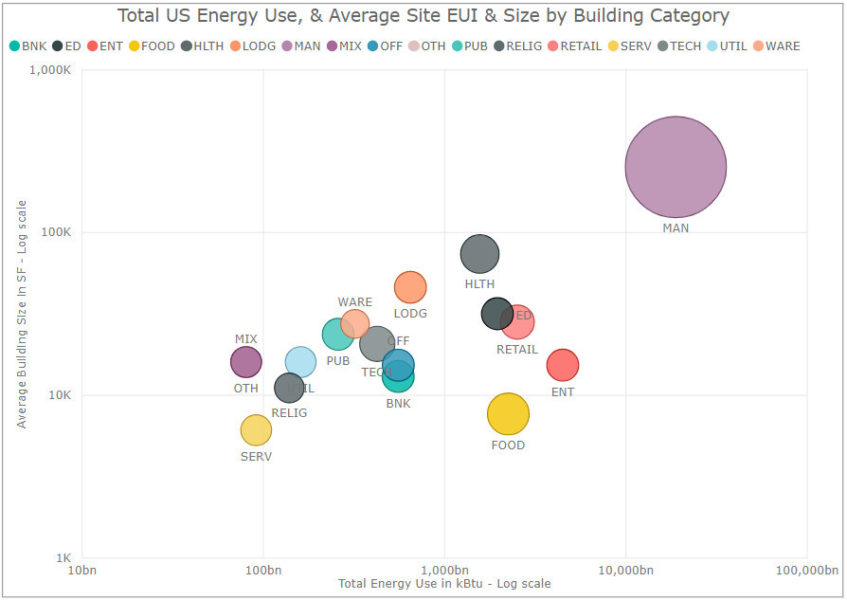
Figure 1. Total energy use, and average site EUI and size by building category in the US based on 2012 CBECS and 2015 MECS data
| Index | Building Category | Total Energy Use (Billion kBtu) | Average Site EUI (kBtu / SF) |
| MAN | Manufacturing | 18.84 | 1,606.8 |
| ENG | Sports & Entertainment | 4.48 | 55.8 |
| RETAIL | Retail | 2.51 | 85.1 |
| FOOD | Food Sales & Service | 2.24 | 182.23 |
| ED | Education | 1.95 | 53.21 |
| HLTH | Healthcare | 1.57 | 132.57 |
| LODG | Lodging / Residential | 0.65 | 60.9 |
| OFF | Office | 0.55 | 54.3 |
| BNK | Banking / Financial Services | 0.55 | 56.2 |
| TECH | Technology / Science | 0.42 | 95.0 |
| WRE | Warehouse / Storage | 0.32 | 24.5 |
| PUB | Public Relations | 0.26 | 62.2 |
| UTIL | Utility | 0.16 | 40.1 |
| RELIG | Religious Worship | 0.14 | 30.5 |
| SERV | Services | 0.09 | 47.9 |
| OTH | Other | 0.08 | 40.1 |
| MIX | Mixed Use | 0.08 | 40.1 |
Table 1. Building Categories List highlighting the energy intensive categories
In the next post we will explore energy-saving strategies for the highest energy building category in the U.S.: Manufacturing.
[1] https://www.un.org/en/sections/issues-depth/climate-change/
[2] https://yearbook.enerdata.net/total-energy/world-consumption-statistics.html
[3] https://www.eia.gov/energyexplained/index.php?page=environment_where_ghg_come_from
[4] https://portfoliomanager.energystar.gov/pdf/reference/US%20National%20Median%20Table.pdf


